Say you have a Release mode MSVC++ Win32 Console Application with the following code:
#include "stdafx.h"
#include <iostream>

using namespace std;

void CorruptTheHeap()
{
	// Create a pointer to an integer.
	int *reallyBadlyCodedIntegerAllocation;
	// Allocate insufficient space for this memory space to store an actual integer.
	cout << "The expected memory size of this type is " << sizeof(int) << " bytes, which is " << 8*sizeof(int) << " bits." << endl;
	int sizeToAllocateForThisType = 0;
	cout << "The actual size of this integer will be set to " << sizeToAllocateForThisType << " bytes." << endl;
	reallyBadlyCodedIntegerAllocation = (int *)malloc(sizeToAllocateForThisType);
	// Try to set the integer to an integer value (causing a memory leak at this point since we are writing over the bounds of the memory we actually own).
	*reallyBadlyCodedIntegerAllocation = 0;
	// Trying to free this integer would cause a heap corruption because it will try to free the size of the type, but we have allocated it to be nothing. In a Release build, this will cause a crash.
	free(reallyBadlyCodedIntegerAllocation);
}

int _tmain(int argc, _TCHAR* argv[])
{
	CorruptTheHeap();
	cout << "Press any key to exit." << endl;
	cin.get();
	return 0;
}
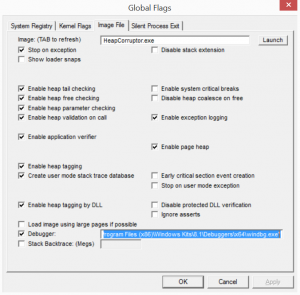
Make sure the application’s project settings build it so that its *.pdb file(s) is or are in the same folder as where you execute it. Now get WinDbg, which contains Global Flags. For this example, my application is built in Release (must be in Release) as an x64 architecture application, so the next step for me is to start Global Flags (X64). A simple Windows start screen search for Global Flags should uncover it, but for me it installed at C:\Program Files (x86)\Windows Kits\8.1\Debuggers\x64\gflags.exe. Open it up, go to the Image File tab. Type in the name of your Image file. For me, my Console Application compiles and runs as HeapCorruptor.exe, so I typed that in, and pressed the TAB key on my keyboard. You’ll notice that when running Global Flags, it seems to keep track of executables based on their name, so when you restart and go through the same process of typing in the executable’s name and press the TAB key, it loads your last configuration (I know, its kind of weird and takes a bit of getting used to).
Check off Debugger and set its path to the path of your WinDbg executable. For me, a default setup of the debugging tools installed WinDbg at “C:\Program Files (x86)\Windows Kits\8.1\Debuggers\x64\windbg.exe”. Then set up any other necessary flags, as I have in the screenshot below, hit Apply, and then OK to close it down.

Now, run your executable. Global Flags will start up along with it. It starts paused, so type in g (for go) to get it to continue, or hit F5 in Global Flags. After you type in g and hit enter, you should see an error as the application starts up and runs:
0:000> g


===========================================================
VERIFIER STOP 000000000000000F: pid 0x3DC0: corrupted suffix pattern

	0000003E3B071000 : Heap handle
	0000003E3C191500 : Heap block
	0000000000000001 : Block size
	0000003E3C191501 : corruption address
===========================================================
This verifier stop is not continuable. Process will be terminated
when you use the `go' debugger command.
We have caught a heap corruption at memory address 0000003E3C191500. Type in !heap –p –a 0000003E3C191500 to get more information on the error:
    address 0000003e3c191500 found in
    _HEAP @ 3e3c150000
              HEAP_ENTRY Size Prev Flags            UserPtr UserSize - state
        0000003e3c1914b0 0008 0000  [00]   0000003e3c191500    00001 - (busy)
        7ffc110a83f3 verifier!VerifierDisableFaultInjectionExclusionRange+0x00000000000022ff
        7ffc4e438e98 ntdll!RtlpNtMakeTemporaryKey+0x0000000000000330
        7ffc4e3f333a ntdll!memset+0x00000000000148fa
        7ffc4e3774e7 ntdll!RtlAllocateHeap+0x0000000000000187
        7ffc110c17ab verifier!VerifierGetPropertyValueByName+0x00000000000133cf
*** ERROR: Symbol file could not be found.  Defaulted to export symbols for C:\WINDOWS\SYSTEM32\MSVCR120.dll -
        7ffc10e96a57 MSVCR120!malloc+0x000000000000005b
*** WARNING: Unable to verify checksum for HeapCorruptor.exe
        7ff7698d1316 HeapCorruptor!CorruptTheHeap+0x00000000000000a6
        7ff7698d1339 HeapCorruptor!wmain+0x0000000000000009
        7ff7698d1e37 HeapCorruptor!__tmainCRTStartup+0x000000000000010f
*** ERROR: Symbol file could not be found.  Defaulted to export symbols for C:\WINDOWS\system32\KERNEL32.DLL -
        7ffc4bc216ad KERNEL32!BaseThreadInitThunk+0x000000000000000d
        7ffc4e3b4629 ntdll!RtlUserThreadStart+0x000000000000001d
This is great because it shows us some important bits of information, like the call-stack that caused our corruption. In particular, we can see that CorruptTheHeap() was called and that, while running it, Global Flags was then unable to verify a check-sum, so we can pinpoint the problem to be in that function…sometimes Global Flags may show you even more granular methods of underlying framework code that you are using to help you drill down to the actual function causing problems, but in a nutshell that’s essentially it. Make sure to follow the steps above and disable all check-boxes for the context of that executable’s name in Global Flags, or else it will always start with your executable.